During the summer of 2014, in the midst of one of the worst droughts the Western United States in decades, the water main under Los Angeles’ famous Sunset Boulevard ruptured. For the next four hours it pumped millions of gallons of water onto the streets of the surrounding community, flooding intersections and snarling traffic. It even swamped the recently renovated basketball court at UCLA’s Pauley Pavilion.
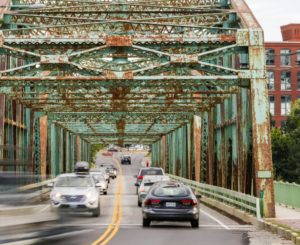
 Still, you couldn’t call Angelenos surprised. The pipe that broke underneath LA was nearly a century old, and those pipes break regularly. But just as the state of disrepair in the city’s water infrastructure was no secret, its indicative of a problem with public infrastructure across the country. America’s roads, bridges, waterways, and energy grids need a serious upgrade. There is a current $900 billion investment backlog for all forms of transportation infrastructure across the United States. Why has so much of it gone unfixed?
SIMPLY PUT: BECAUSE CONGRESS HASN’T PASSED A LONG-TERM TRANSPORTATION INFRASTRUCTURE FUNDING BILL IN NEARLY A DECADE.
According to a report commissioned in Fall 2014 by the Alliance for American Manufacturing (AAM) and preapred by the Duke University Center of Globalization, Governance & Competitiveness (CGGC), America’s decaying public infrastructure — and our inability to address it — costs the United States dearly in both business and employment opportunities for its citizens.
We all benefit from efficient transportation infrastructure. Workers need good roads to get to work. Manufacturers need strong rail networks to get products to market. And farmers need sound bridges to send commodities all across the globe.
America needs infrastructure that works. The only question is: Will Washington rise above its inaction?
Falling Behind
U.S. infrastructure doesn’t stack up well with the competition.
America is home to an impressive amount of infrastructure. In fact, the United States boasts the world’s largest national stock of bridges, airports, and seaports and combined miles of roads, rails, pipelines, and inland waterways. We’ve got it all, and in large quantities. But the quality of this infrastructure leaves a lot to be desired.
 According to the CGGC report, congestion rates across virtually all modes of the U.S. transportation grid are maxing out. The negative effects for commuters are pretty clear to anyone who’s ever been caught in an explicable traffic jam on an interstate highway. But for businesses, the effects of congestion are felt directly in their bottom lines; a slower transportation grid means business productivity loss, reduced reliability, increased pollution, and excessive wear-and-tear on assets used to deliver goods to market. In fact, a 2007 study by the U.S. Department of Transportation (DOT) found that congestion across all modes of transport resulted in approximately $200 billion in direct losses to the national economy. Another study found that outdated equipment in key U.S. railyards costs the economy another $200 billion per year in economic activity alone.
The United States, despite its huge stock in transportation infrastructure, puts only 1.7 percent of its annual GDP toward infrastructure maintenance and construction. The European Union, a major U.S. trading partner, puts in 7.2 percent, and the United Kingdom puts in 8.9 percent.
HERE’S HOW THAT UNDERINVESTMENT TRANSLATES INTO COMPETITIVE TERMS:
- Deficient and decaying infrastructure makes the United States less competitive than many of our top trading partners, with global assessments ranking the United States 16th out of 144 nations and sixth among our top 15 trading partners.
-
- The U.S. invests on average $848 per person annually on transportation investments compared to the European Union’s $2,589 per person. This underinvestment has contributed to a $900 billion backlog in needed investments and repairs in the U.S.
- Meanwhile, every dollar invested in transportation infrastructure returns $3.54 in economic impact.That’s a nearly unmatchable return on investment for public spending.
So what are we waiting for?
Employment Potential
A serious infrastructure investment will put more Americans back to work.
What does a $1 billion buy you?
You could buy a major American sports franchise, with some change leftover, or even a handful of Boeing 787s. But doing so wouldn’t return much of a bang for your buck to the general public.
But $1 billion spent on public transportation infrastructure has a much greater effect: More than 21,000 jobs.
That’s right. Infrastructure investment not only generates a lot of economic activity around it ($3.54 for every $1 spent) but it’s guaranteed to put more Americans to work. In fact, the money currently devoted to infrastructure spending by U.S. DOT is responsible for XX jobs in our economy.
According to the report from CGGC, a low-end investment in infrastructure spending would create more than 1.5 million American jobs ,with more than 10 percent of of them coming in the manufacturing sector that historically pays a wage higher than comparable jobs in the service and retail sectors. A high-end investment, on the other hand, could create nearly 2.5 million jobs for the American economy, and employment in all 50 states.
Buy America
A Tale of Two Bridges
In 2007, the state of California set out to replace the ailing San Francisco Oakland Bay Bridge, damaged years earlier by a major earthquake. A few years later and a few thousand miles away, the state of New York began a rebuild of its heavily trafficked Tappan Zee Bridge. The differing ways in which these projects were pursued produced drastically different results.
THE BAY BRIDGE FIASCO
After a long and opaque procurement process in the early 2000s, Califorina Department of Transportation (CalTrans) officials announced the winning bidder to produce the steel in the central span of the rebuilt Bay Bridge: A state-owned enterprise from China that offered to complete the project for $400 million less that its closest American competitor.
Unfortunately, those cost savings didn’t pan out. The project ran late, and the Chinese company ultimately added $350 million in cost overruns, and the quality of the workmanship has required millions of dollars more worth of remedial work. No American jobs were created by the billions of California taxpayers’ dollars spent on Chinese steel, but CalTrans’ decision did manage to create jobs for 3,000 Chinese workers, who were reportedly paid between $9 and $12 per hour to work 16-hour shifts.
THE TAPPAN ZEE APPROACH
The reconstruction of New York’s Governor Malcolm Wilson Tappan Zee Bridge — the Tappan Zee, for short — was tapped as as fast-track infrastructure project by President Obama in 2011. But unlike other bridge-building projects such as the Verrazano Bridge elsewhere in New York, or the aforementioned Bay Bridge in California, officials found it cost-competitive to tap an American consortium, Tappan Zee Constructors (TZC), to produce the project’s steel.
Here’s how they did it: A $1.6 billion grant secured by the state of New York from the U.S. Department of
 Transportation’s Infrastructure Finance and Innovation Act (TIFIA) program — the largest TIFIA funding amount ever granted to a single project to date — that covered roughly 40 percent of the total cost of the new bridge. But while TIFIA grants are meant to provide a firm financial foundation to entice private sector participation into transportation projects, they also come with Buy America preferences for the iron and steel construction materials that they’ll purchase.
Not a problem for TZC. It contracted with steelmakers ArcelorMittal, HighSteel Structures, and Hirschfield Industries for the bulk of the fabrication — all with extensive American production facilities. Since the TZC steel is all from U.S. sites, the project will be Buy America compliant.
So what benefits can be expected from such an American-made approach? According to an economic impact study done by New York, the project will generate over five years:
- 7,728 unique full-time jobs;
- $3.2 billion in newly generated GDP;
- $5.6 billion in total value of all goods produced;
- $3.7 billion in new personal income generated; and
- $2. billion in real disposable personal income.
Looks like New York officials, unlike their counterparts in California, didn’t get duped by a mysteriously cheap price tag for procurement costs. We’d call that a clear success for New York’s regional economy.
The Plan
America’s transportation infrastructure is falling apart. Our roads, bridges, railways, waterways, pipelines, and energy grids need serious maintenance in order to maintain a well-functioning economy and U.S. cometitiviness in the world. And a serious, long-term investment would not only address these problems, but create millions of distinctly American jobs while doing so.
But despite mountains of evidence that now is the time to act, U.S. policymakers haven’t acted. That must end. It’s up to each of us, as citizens, to let our elected officials know that we want the persistent problem of infrastructure underinvestment fixed.


September 15, 2017
Ꮋi there, I enjoy reading all of your article
post. I like to writе a little comment to suppoгt you.